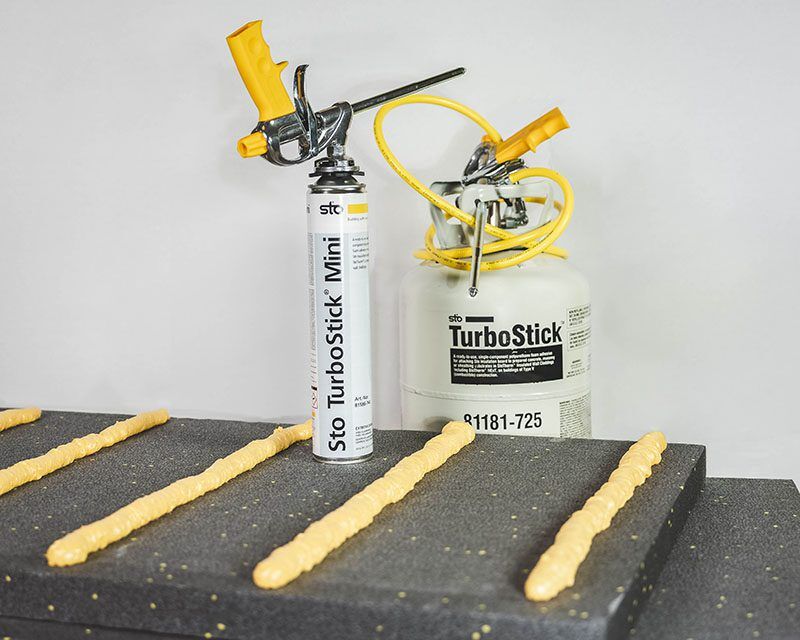
EPD for Sto TurboStick® Sto TurboStick® is a ready-to-use, single component polyure-thane foam adhesive for secur-ing Sto EPS Insulation Boards in StoTherm® exterior wall clad-dings including StoTherm® ci XPS. Sto TurboStick® is also used to attach continuous insu-lation in StoEnergy Guard® ap-plications.
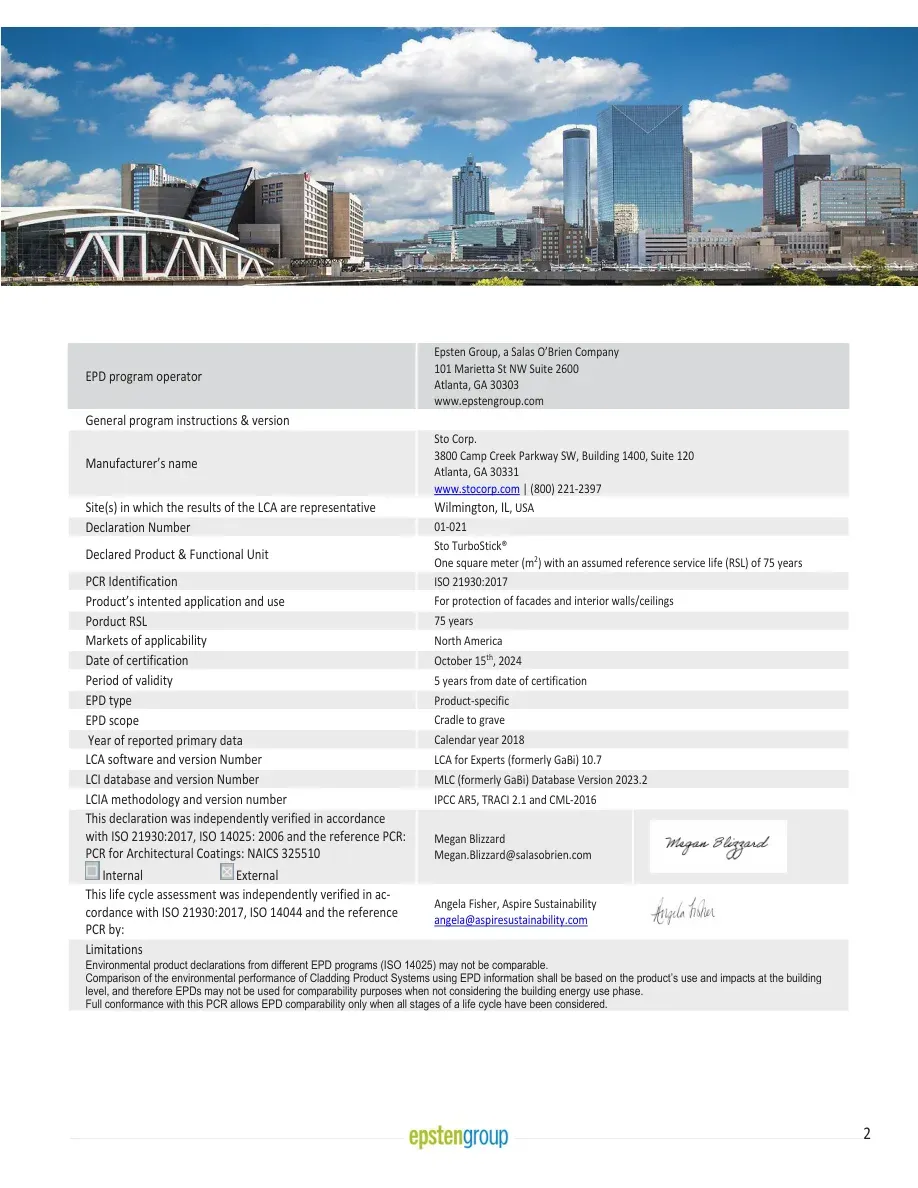
2 EPD program operator Epsten Group, a Salas O’Brien Company 101 Marietta St NW Suite 2600 Atlanta, GA 30303 www.epstengroup.com General program instructions & version Manufacturer’s name Sto Corp. 3800 Camp Creek Parkway SW, Building 1400, Suite 120 Atlanta, GA 30331 www.stocorp.com | (800) 221-2397 Site(s) in which the results of the LCA are representative Wilmington, IL, USA Declaration Number 01-021 Declared Product & Functional Unit Sto TurboStick® One square meter (m2) with an assumed reference service life (RSL) of 75 years PCR Identification ISO 21930:2017 Product’s intented application and use For protection of facades and interior walls/ceilings Porduct RSL 75 years Markets of applicability North America Date of certification October 15th, 2024 Period of validity 5 years from date of certification EPD type Product-specific EPD scope Cradle to grave Year of reported primary data Calendar year 2018 LCA software and version Number LCA for Experts (formerly GaBi) 10.7 LCI database and version Number MLC (formerly GaBi) Database Version 2023.2 LCIA methodology and version number IPCC AR5, TRACI 2.1 and CML-2016 This declaration was independently verified in accordance with ISO 21930:2017, ISO 14025: 2006 and the reference PCR: PCR for Architectural Coatings: NAICS 325510 Internal External Megan Blizzard Megan.Blizzard@salasobrien.com This life cycle assessment was independently verified in ac-cordance with ISO 21930:2017, ISO 14044 and the reference PCR by: Angela Fisher, Aspire Sustainability angela@aspiresustainability.com Limitations Environmental product declarations from different EPD programs (ISO 14025) may not be comparable. Comparison of the environmental performance of Cladding Product Systems using EPD information shall be based on the product’s use and impacts at the building level, and therefore EPDs may not be used for comparability purposes when not considering the building energy use phase. Full conformance with this PCR allows EPD comparability only when all stages of a life cycle have been considered.
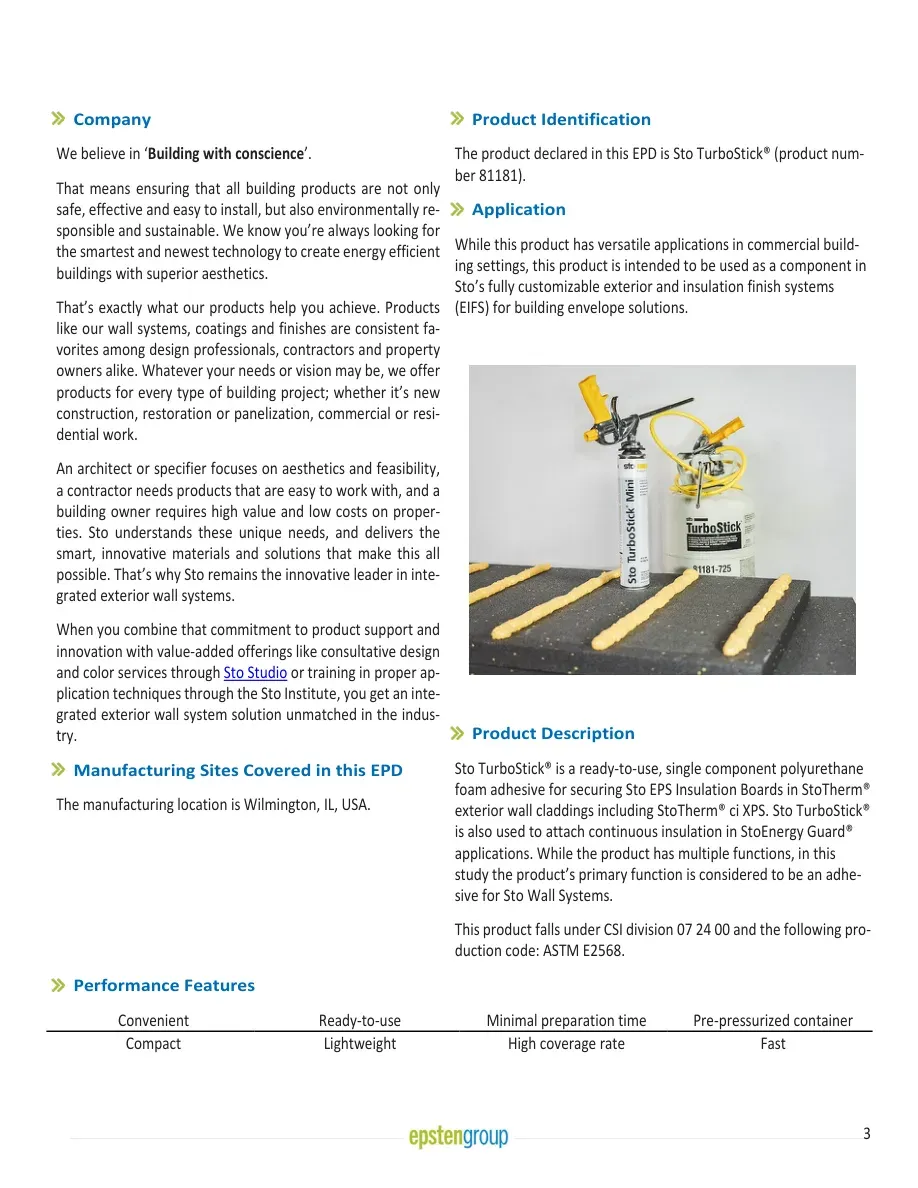
3 Company We believe in ‘Building with conscience’. That means ensuring that all building products are not only safe, effective and easy to install, but also environmentally re-sponsible and sustainable. We know you’re always looking for the smartest and newest technology to create energy efficient buildings with superior aesthetics. That’s exactly what our products help you achieve. Products like our wall systems, coatings and finishes are consistent fa-vorites among design professionals, contractors and property owners alike. Whatever your needs or vision may be, we offer products for every type of building project; whether it’s new construction, restoration or panelization, commercial or resi-dential work. An architect or specifier focuses on aesthetics and feasibility, a contractor needs products that are easy to work with, and a building owner requires high value and low costs on proper-ties. Sto understands these unique needs, and delivers the smart, innovative materials and solutions that make this all possible. That’s why Sto remains the innovative leader in inte-grated exterior wall systems. When you combine that commitment to product support and innovation with value-added offerings like consultative design and color services through Sto Studio or training in proper ap-plication techniques through the Sto Institute, you get an inte-grated exterior wall system solution unmatched in the indus-try. Manufacturing Sites Covered in this EPD The manufacturing location is Wilmington, IL, USA. Product Identification The product declared in this EPD is Sto TurboStick® (product num-ber 81181). Application While this product has versatile applications in commercial build-ing settings, this product is intended to be used as a component in Sto’s fully customizable exterior and insulation finish systems (EIFS) for building envelope solutions. Product Description Sto TurboStick® is a ready-to-use, single component polyurethane foam adhesive for securing Sto EPS Insulation Boards in StoTherm® exterior wall claddings including StoTherm® ci XPS. Sto TurboStick® is also used to attach continuous insulation in StoEnergy Guard® applications. While the product has multiple functions, in this study the product’s primary function is considered to be an adhe-sive for Sto Wall Systems. This product falls under CSI division 07 24 00 and the following pro-duction code: ASTM E2568. Performance Features Convenient Ready-to-use Minimal preparation time Pre-pressurized container Compact Lightweight High coverage rate Fast
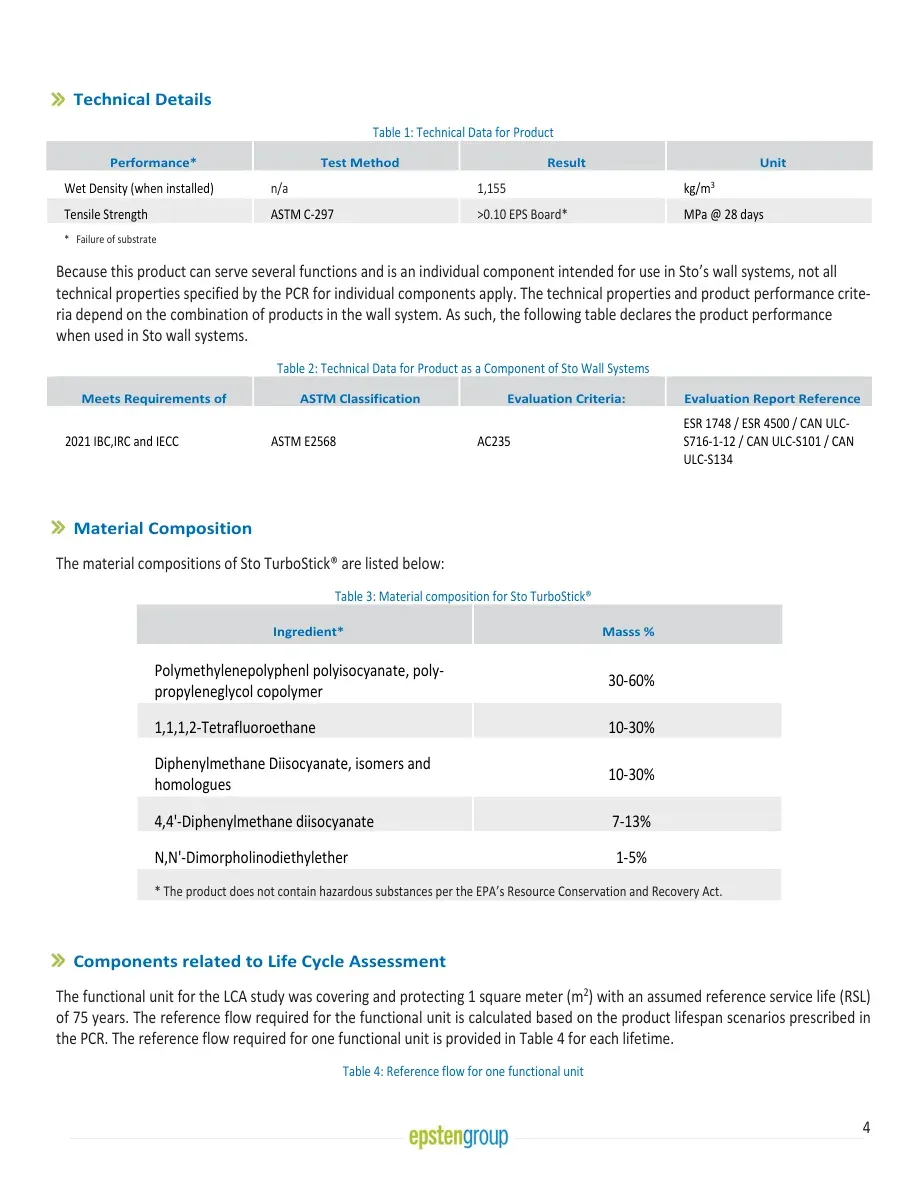
4 Technical Details Table 1: Technical Data for Product Performance* Test Method Result Unit Wet Density (when installed) n/a 1,155 kg/m3 Tensile Strength ASTM C-297 >0.10 EPS Board* MPa @ 28 days * Failure of substrate Because this product can serve several functions and is an individual component intended for use in Sto’s wall systems, not all technical properties specified by the PCR for individual components apply. The technical properties and product performance crite-ria depend on the combination of products in the wall system. As such, the following table declares the product performance when used in Sto wall systems. Table 2: Technical Data for Product as a Component of Sto Wall Systems Meets Requirements of ASTM Classification Evaluation Criteria: Evaluation Report Reference 2021 IBC,IRC and IECC ASTM E2568 AC235 ESR 1748 / ESR 4500 / CAN ULC-S716-1-12 / CAN ULC-S101 / CAN ULC-S134 Material Composition The material compositions of Sto TurboStick® are listed below: Table 3: Material composition for Sto TurboStick® Ingredient* Masss % Polymethylenepolyphenl polyisocyanate, poly-propyleneglycol copolymer 30-60% 1,1,1,2-Tetrafluoroethane 10-30% Diphenylmethane Diisocyanate, isomers and homologues 10-30% 4,4'-Diphenylmethane diisocyanate 7-13% N,N'-Dimorpholinodiethylether 1-5% * The product does not contain hazardous substances per the EPA’s Resource Conservation and Recovery Act. Components related to Life Cycle Assessment The functional unit for the LCA study was covering and protecting 1 square meter (m2) with an assumed reference service life (RSL) of 75 years. The reference flow required for the functional unit is calculated based on the product lifespan scenarios prescribed in the PCR. The reference flow required for one functional unit is provided in Table 4 for each lifetime. Table 4: Reference flow for one functional unit
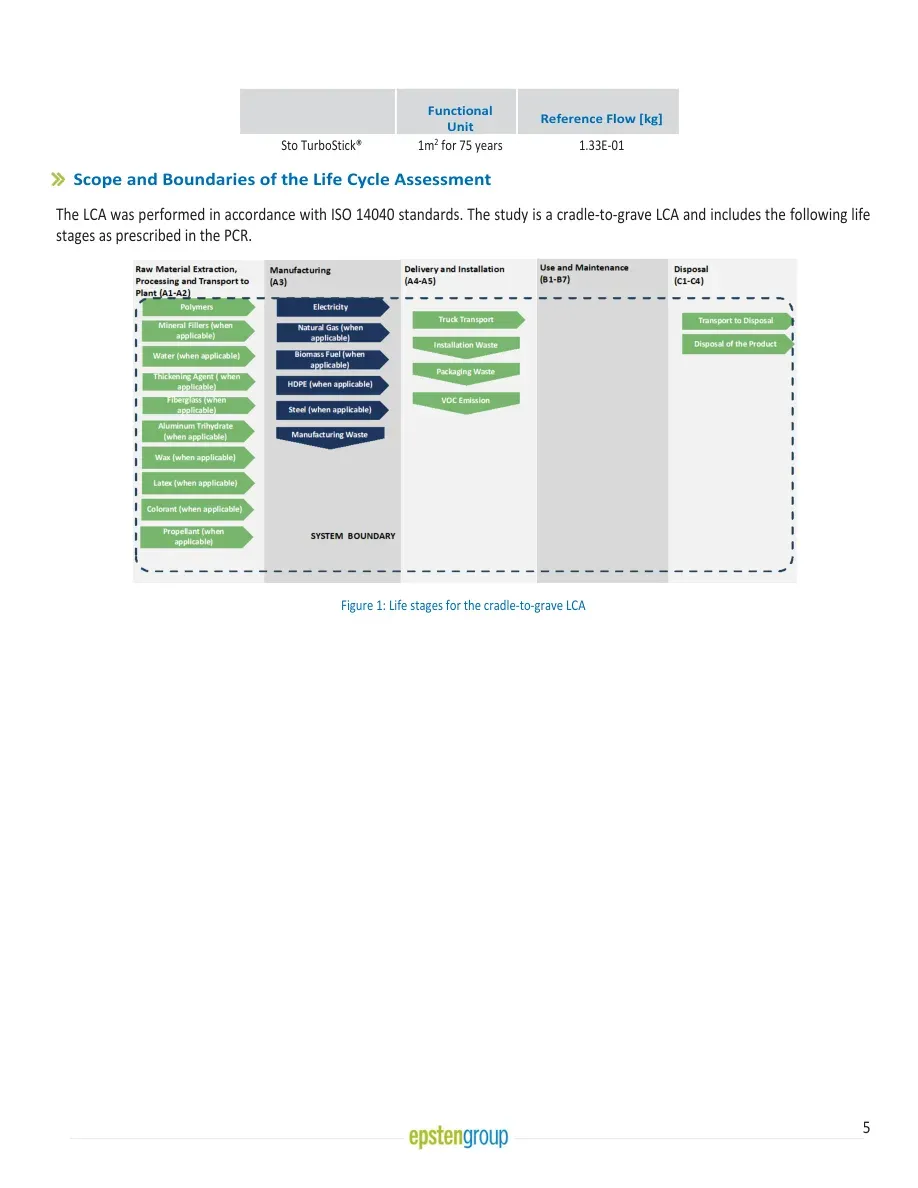
5 Functional Unit Reference Flow [kg] Sto TurboStick® 1m2 for 75 years 1.33E-01 Scope and Boundaries of the Life Cycle Assessment The LCA was performed in accordance with ISO 14040 standards. The study is a cradle-to-grave LCA and includes the following life stages as prescribed in the PCR. Figure 1: Life stages for the cradle-to-grave LCA
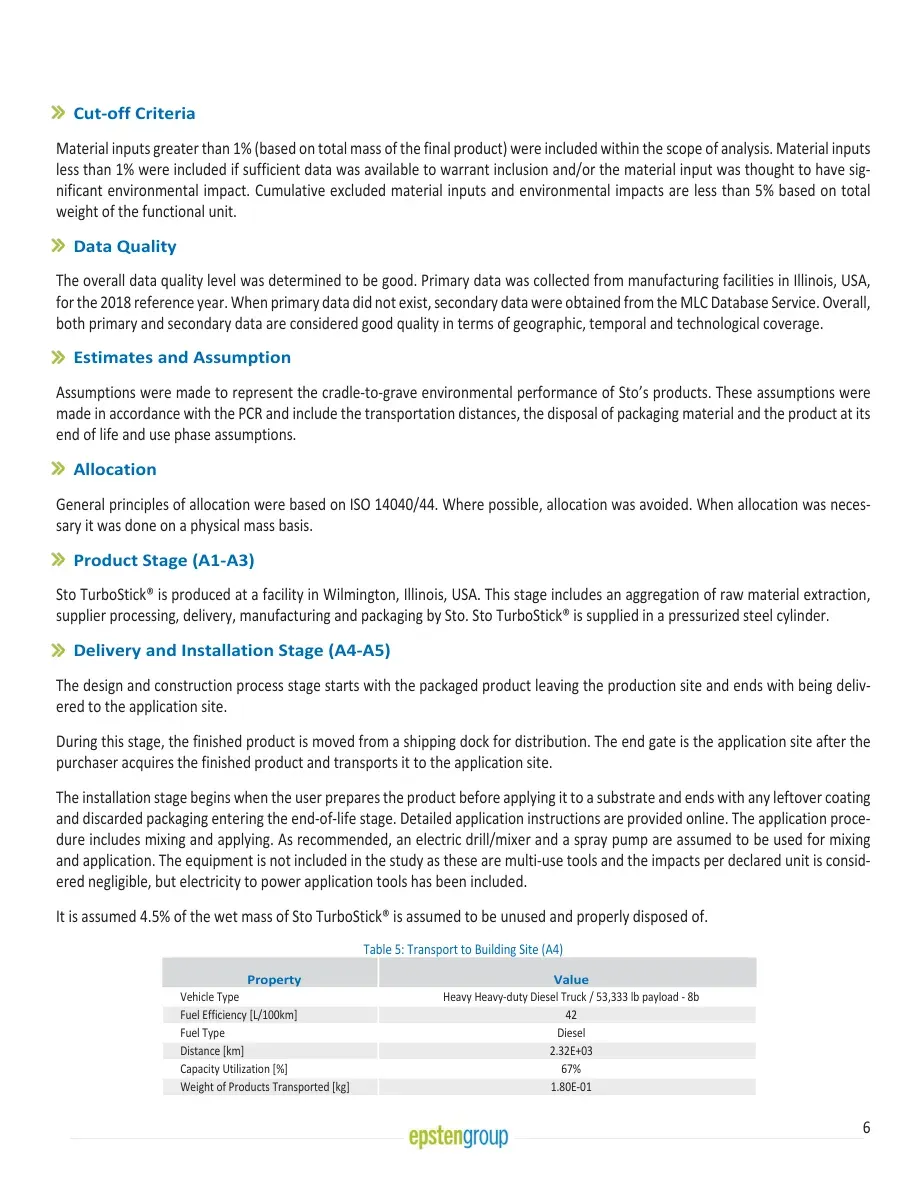
6 Cut-off Criteria Material inputs greater than 1% (based on total mass of the final product) were included within the scope of analysis. Material inputs less than 1% were included if sufficient data was available to warrant inclusion and/or the material input was thought to have sig-nificant environmental impact. Cumulative excluded material inputs and environmental impacts are less than 5% based on total weight of the functional unit. Data Quality The overall data quality level was determined to be good. Primary data was collected from manufacturing facilities in Illinois, USA, for the 2018 reference year. When primary data did not exist, secondary data were obtained from the MLC Database Service. Overall, both primary and secondary data are considered good quality in terms of geographic, temporal and technological coverage. Estimates and Assumption Assumptions were made to represent the cradle-to-grave environmental performance of Sto’s products. These assumptions were made in accordance with the PCR and include the transportation distances, the disposal of packaging material and the product at its end of life and use phase assumptions. Allocation General principles of allocation were based on ISO 14040/44. Where possible, allocation was avoided. When allocation was neces-sary it was done on a physical mass basis. Product Stage (A1-A3) Sto TurboStick® is produced at a facility in Wilmington, Illinois, USA. This stage includes an aggregation of raw material extraction, supplier processing, delivery, manufacturing and packaging by Sto. Sto TurboStick® is supplied in a pressurized steel cylinder. Delivery and Installation Stage (A4-A5) The design and construction process stage starts with the packaged product leaving the production site and ends with being deliv-ered to the application site. During this stage, the finished product is moved from a shipping dock for distribution. The end gate is the application site after the purchaser acquires the finished product and transports it to the application site. The installation stage begins when the user prepares the product before applying it to a substrate and ends with any leftover coating and discarded packaging entering the end-of-life stage. Detailed application instructions are provided online. The application proce-dure includes mixing and applying. As recommended, an electric drill/mixer and a spray pump are assumed to be used for mixing and application. The equipment is not included in the study as these are multi-use tools and the impacts per declared unit is consid-ered negligible, but electricity to power application tools has been included. It is assumed 4.5% of the wet mass of Sto TurboStick® is assumed to be unused and properly disposed of. Table 5: Transport to Building Site (A4) Property Value Vehicle Type Heavy Heavy-duty Diesel Truck / 53,333 lb payload - 8b Fuel Efficiency [L/100km] 42 Fuel Type Diesel Distance [km] 2.32E+03 Capacity Utilization [%] 67% Weight of Products Transported [kg] 1.80E-01
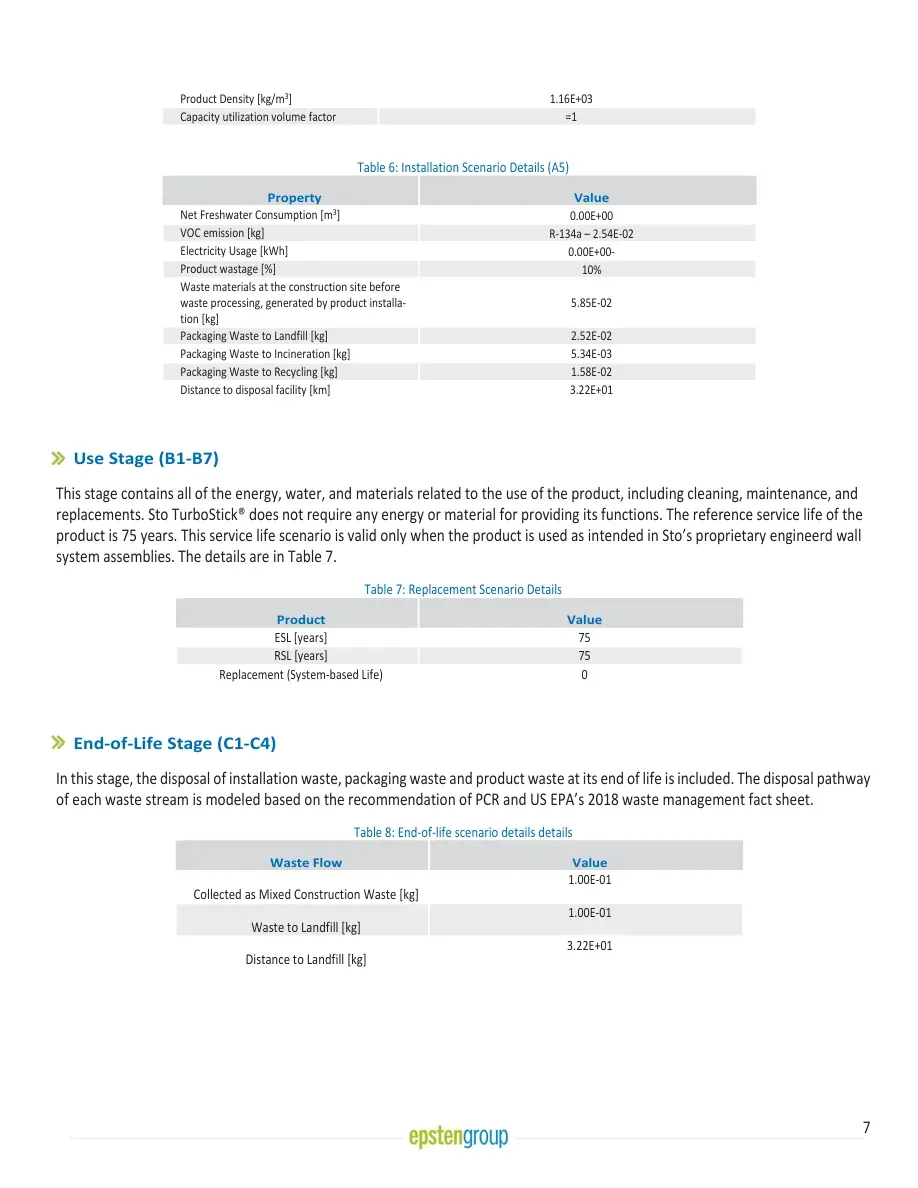
7 Product Density [kg/m3] 1.16E+03 Capacity utilization volume factor =1 Table 6: Installation Scenario Details (A5) Property Value Net Freshwater Consumption [m3] 0.00E+00 VOC emission [kg] R-134a – 2.54E-02 Electricity Usage [kWh] 0.00E+00- Product wastage [%] 10% Waste materials at the construction site before waste processing, generated by product installa-tion [kg] 5.85E-02 Packaging Waste to Landfill [kg] 2.52E-02 Packaging Waste to Incineration [kg] 5.34E-03 Packaging Waste to Recycling [kg] 1.58E-02 Distance to disposal facility [km] 3.22E+01 Use Stage (B1-B7) This stage contains all of the energy, water, and materials related to the use of the product, including cleaning, maintenance, and replacements. Sto TurboStick® does not require any energy or material for providing its functions. The reference service life of the product is 75 years. This service life scenario is valid only when the product is used as intended in Sto’s proprietary engineerd wall system assemblies. The details are in Table 7. Table 7: Replacement Scenario Details Product Value ESL [years] 75 RSL [years] 75 Replacement (System-based Life) 0 End-of-Life Stage (C1-C4) In this stage, the disposal of installation waste, packaging waste and product waste at its end of life is included. The disposal pathway of each waste stream is modeled based on the recommendation of PCR and US EPA’s 2018 waste management fact sheet. Table 8: End-of-life scenario details details Waste Flow Value Collected as Mixed Construction Waste [kg] 1.00E-01 Waste to Landfill [kg] 1.00E-01 Distance to Landfill [kg] 3.22E+01
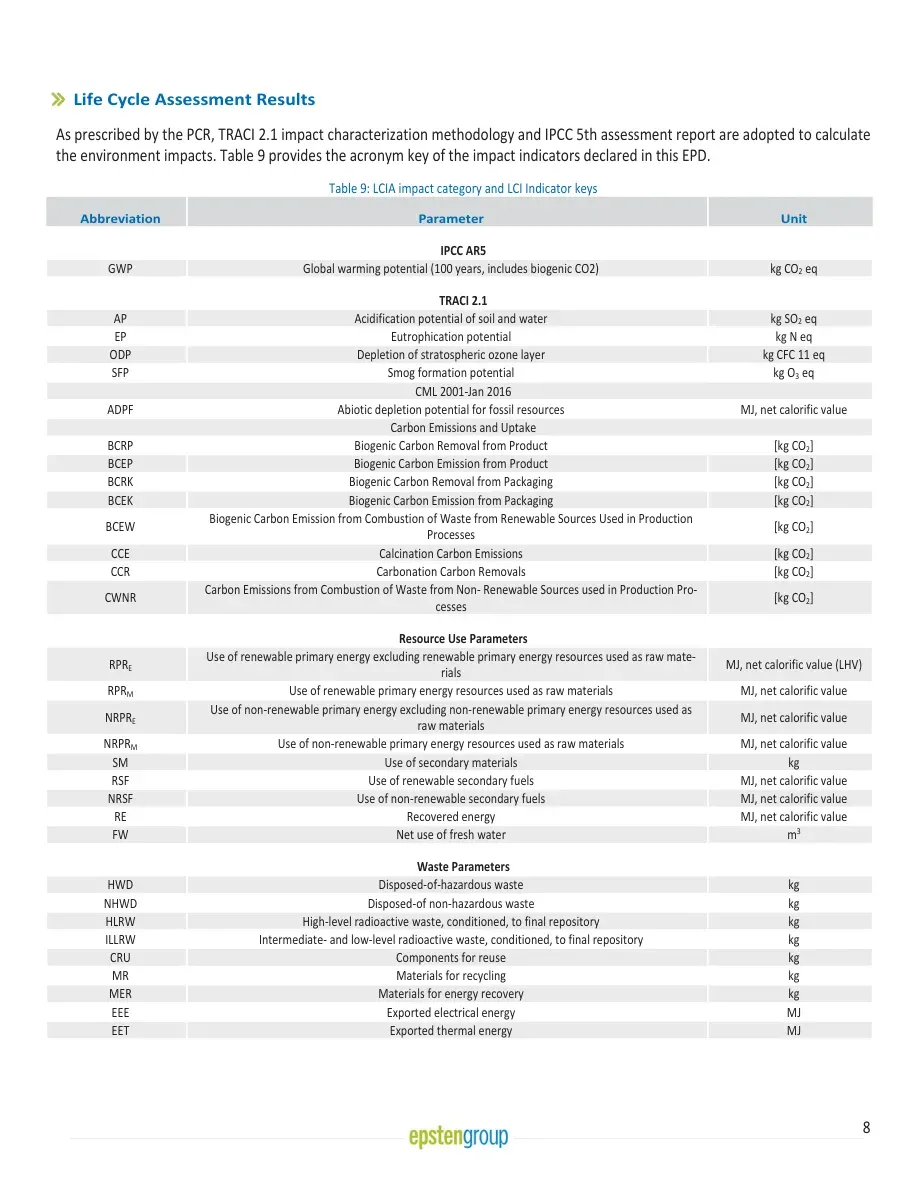
8 Life Cycle Assessment Results As prescribed by the PCR, TRACI 2.1 impact characterization methodology and IPCC 5th assessment report are adopted to calculate the environment impacts. Table 9 provides the acronym key of the impact indicators declared in this EPD. Table 9: LCIA impact category and LCI Indicator keys Abbreviation Parameter Unit IPCC AR5 GWP Global warming potential (100 years, includes biogenic CO2) kg CO2 eq TRACI 2.1 AP Acidification potential of soil and water kg SO2 eq EP Eutrophication potential kg N eq ODP Depletion of stratospheric ozone layer kg CFC 11 eq SFP Smog formation potential kg O3 eq CML 2001-Jan 2016 ADPF Abiotic depletion potential for fossil resources MJ, net calorific value Carbon Emissions and Uptake BCRP Biogenic Carbon Removal from Product [kg CO2] BCEP Biogenic Carbon Emission from Product [kg CO2] BCRK Biogenic Carbon Removal from Packaging [kg CO2] BCEK Biogenic Carbon Emission from Packaging [kg CO2] BCEW Biogenic Carbon Emission from Combustion of Waste from Renewable Sources Used in Production Processes [kg CO2] CCE Calcination Carbon Emissions [kg CO2] CCR Carbonation Carbon Removals [kg CO2] CWNR Carbon Emissions from Combustion of Waste from Non- Renewable Sources used in Production Pro-cesses [kg CO2] Resource Use Parameters RPRE Use of renewable primary energy excluding renewable primary energy resources used as raw mate-rials MJ, net calorific value (LHV) RPRM Use of renewable primary energy resources used as raw materials MJ, net calorific value NRPRE Use of non-renewable primary energy excluding non-renewable primary energy resources used as raw materials MJ, net calorific value NRPRM Use of non-renewable primary energy resources used as raw materials MJ, net calorific value SM Use of secondary materials kg RSF Use of renewable secondary fuels MJ, net calorific value NRSF Use of non-renewable secondary fuels MJ, net calorific value RE Recovered energy MJ, net calorific value FW Net use of fresh water m3 Waste Parameters HWD Disposed-of-hazardous waste kg NHWD Disposed-of non-hazardous waste kg HLRW High-level radioactive waste, conditioned, to final repository kg ILLRW Intermediate- and low-level radioactive waste, conditioned, to final repository kg CRU Components for reuse kg MR Materials for recycling kg MER Materials for energy recovery kg EEE Exported electrical energy MJ EET Exported thermal energy MJ
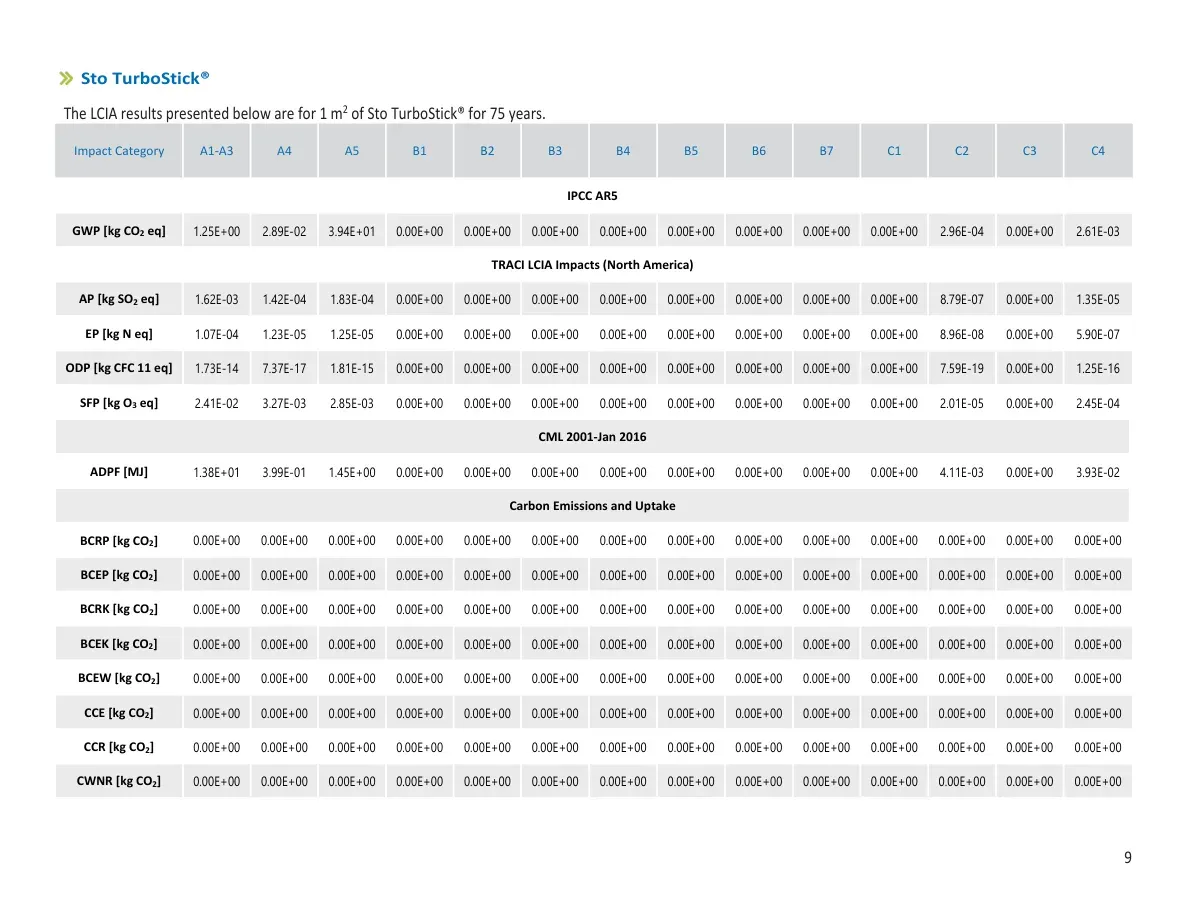
9 Sto TurboStick® The LCIA results presented below are for 1 m2 of Sto TurboStick® for 75 years. Impact Category A1-A3 A4 A5 B1 B2 B3 B4 B5 B6 B7 C1 C2 C3 C4 IPCC AR5 GWP [kg CO2 eq] 1.25E+00 2.89E-02 3.94E+01 0.00E+00 0.00E+00 0.00E+00 0.00E+00 0.00E+00 0.00E+00 0.00E+00 0.00E+00 2.96E-04 0.00E+00 2.61E-03 TRACI LCIA Impacts (North America) AP [kg SO2 eq] 1.62E-03 1.42E-04 1.83E-04 0.00E+00 0.00E+00 0.00E+00 0.00E+00 0.00E+00 0.00E+00 0.00E+00 0.00E+00 8.79E-07 0.00E+00 1.35E-05 EP [kg N eq] 1.07E-04 1.23E-05 1.25E-05 0.00E+00 0.00E+00 0.00E+00 0.00E+00 0.00E+00 0.00E+00 0.00E+00 0.00E+00 8.96E-08 0.00E+00 5.90E-07 ODP [kg CFC 11 eq] 1.73E-14 7.37E-17 1.81E-15 0.00E+00 0.00E+00 0.00E+00 0.00E+00 0.00E+00 0.00E+00 0.00E+00 0.00E+00 7.59E-19 0.00E+00 1.25E-16 SFP [kg O3 eq] 2.41E-02 3.27E-03 2.85E-03 0.00E+00 0.00E+00 0.00E+00 0.00E+00 0.00E+00 0.00E+00 0.00E+00 0.00E+00 2.01E-05 0.00E+00 2.45E-04 CML 2001-Jan 2016 ADPF [MJ] 1.38E+01 3.99E-01 1.45E+00 0.00E+00 0.00E+00 0.00E+00 0.00E+00 0.00E+00 0.00E+00 0.00E+00 0.00E+00 4.11E-03 0.00E+00 3.93E-02 Carbon Emissions and Uptake BCRP [kg CO2] 0.00E+00 0.00E+00 0.00E+00 0.00E+00 0.00E+00 0.00E+00 0.00E+00 0.00E+00 0.00E+00 0.00E+00 0.00E+00 0.00E+00 0.00E+00 0.00E+00 BCEP [kg CO2] 0.00E+00 0.00E+00 0.00E+00 0.00E+00 0.00E+00 0.00E+00 0.00E+00 0.00E+00 0.00E+00 0.00E+00 0.00E+00 0.00E+00 0.00E+00 0.00E+00 BCRK [kg CO2] 0.00E+00 0.00E+00 0.00E+00 0.00E+00 0.00E+00 0.00E+00 0.00E+00 0.00E+00 0.00E+00 0.00E+00 0.00E+00 0.00E+00 0.00E+00 0.00E+00 BCEK [kg CO2] 0.00E+00 0.00E+00 0.00E+00 0.00E+00 0.00E+00 0.00E+00 0.00E+00 0.00E+00 0.00E+00 0.00E+00 0.00E+00 0.00E+00 0.00E+00 0.00E+00 BCEW [kg CO2] 0.00E+00 0.00E+00 0.00E+00 0.00E+00 0.00E+00 0.00E+00 0.00E+00 0.00E+00 0.00E+00 0.00E+00 0.00E+00 0.00E+00 0.00E+00 0.00E+00 CCE [kg CO2] 0.00E+00 0.00E+00 0.00E+00 0.00E+00 0.00E+00 0.00E+00 0.00E+00 0.00E+00 0.00E+00 0.00E+00 0.00E+00 0.00E+00 0.00E+00 0.00E+00 CCR [kg CO2] 0.00E+00 0.00E+00 0.00E+00 0.00E+00 0.00E+00 0.00E+00 0.00E+00 0.00E+00 0.00E+00 0.00E+00 0.00E+00 0.00E+00 0.00E+00 0.00E+00 CWNR [kg CO2] 0.00E+00 0.00E+00 0.00E+00 0.00E+00 0.00E+00 0.00E+00 0.00E+00 0.00E+00 0.00E+00 0.00E+00 0.00E+00 0.00E+00 0.00E+00 0.00E+00
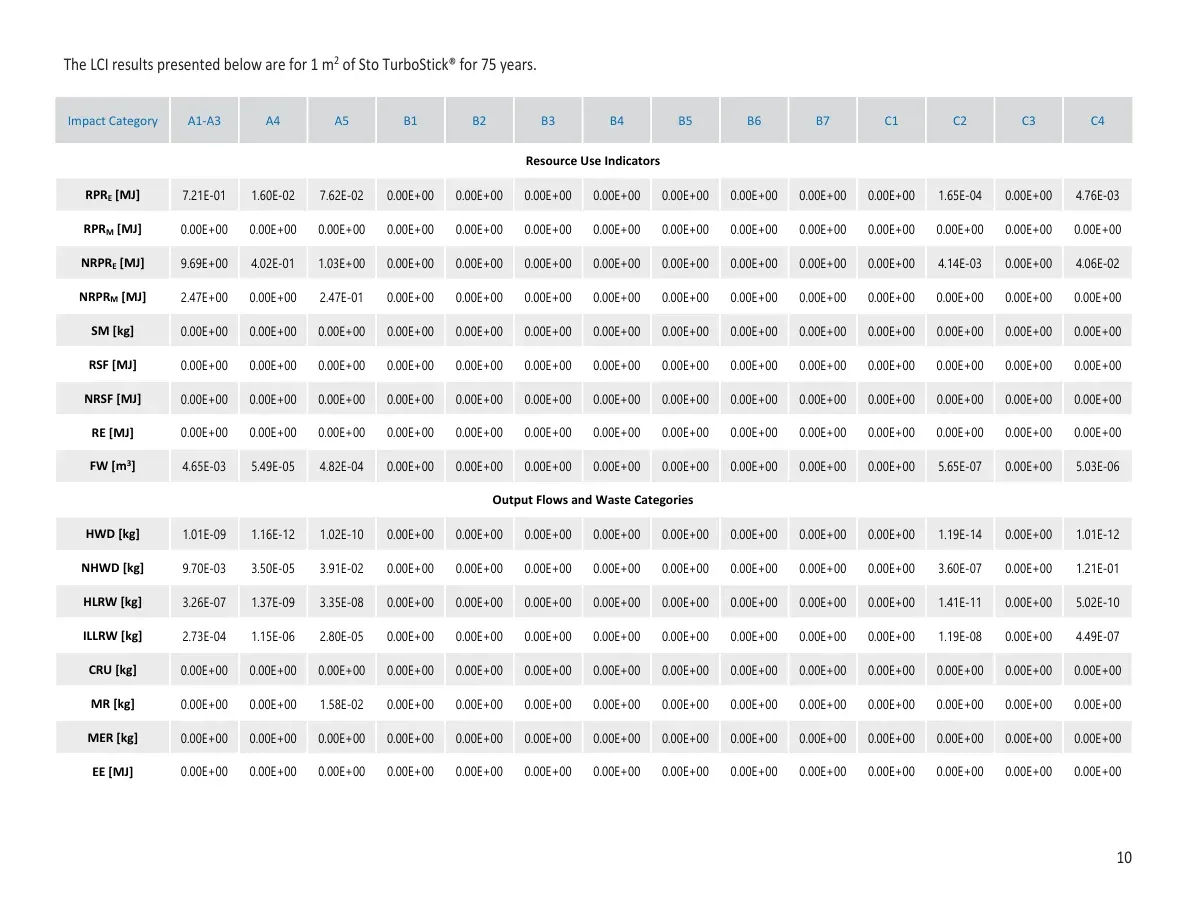
10 The LCI results presented below are for 1 m2 of Sto TurboStick® for 75 years. Impact Category A1-A3 A4 A5 B1 B2 B3 B4 B5 B6 B7 C1 C2 C3 C4 Resource Use Indicators RPRE [MJ] 7.21E-01 1.60E-02 7.62E-02 0.00E+00 0.00E+00 0.00E+00 0.00E+00 0.00E+00 0.00E+00 0.00E+00 0.00E+00 1.65E-04 0.00E+00 4.76E-03 RPRM [MJ] 0.00E+00 0.00E+00 0.00E+00 0.00E+00 0.00E+00 0.00E+00 0.00E+00 0.00E+00 0.00E+00 0.00E+00 0.00E+00 0.00E+00 0.00E+00 0.00E+00 NRPRE [MJ] 9.69E+00 4.02E-01 1.03E+00 0.00E+00 0.00E+00 0.00E+00 0.00E+00 0.00E+00 0.00E+00 0.00E+00 0.00E+00 4.14E-03 0.00E+00 4.06E-02 NRPRM [MJ] 2.47E+00 0.00E+00 2.47E-01 0.00E+00 0.00E+00 0.00E+00 0.00E+00 0.00E+00 0.00E+00 0.00E+00 0.00E+00 0.00E+00 0.00E+00 0.00E+00 SM [kg] 0.00E+00 0.00E+00 0.00E+00 0.00E+00 0.00E+00 0.00E+00 0.00E+00 0.00E+00 0.00E+00 0.00E+00 0.00E+00 0.00E+00 0.00E+00 0.00E+00 RSF [MJ] 0.00E+00 0.00E+00 0.00E+00 0.00E+00 0.00E+00 0.00E+00 0.00E+00 0.00E+00 0.00E+00 0.00E+00 0.00E+00 0.00E+00 0.00E+00 0.00E+00 NRSF [MJ] 0.00E+00 0.00E+00 0.00E+00 0.00E+00 0.00E+00 0.00E+00 0.00E+00 0.00E+00 0.00E+00 0.00E+00 0.00E+00 0.00E+00 0.00E+00 0.00E+00 RE [MJ] 0.00E+00 0.00E+00 0.00E+00 0.00E+00 0.00E+00 0.00E+00 0.00E+00 0.00E+00 0.00E+00 0.00E+00 0.00E+00 0.00E+00 0.00E+00 0.00E+00 FW [m3] 4.65E-03 5.49E-05 4.82E-04 0.00E+00 0.00E+00 0.00E+00 0.00E+00 0.00E+00 0.00E+00 0.00E+00 0.00E+00 5.65E-07 0.00E+00 5.03E-06 Output Flows and Waste Categories HWD [kg] 1.01E-09 1.16E-12 1.02E-10 0.00E+00 0.00E+00 0.00E+00 0.00E+00 0.00E+00 0.00E+00 0.00E+00 0.00E+00 1.19E-14 0.00E+00 1.01E-12 NHWD [kg] 9.70E-03 3.50E-05 3.91E-02 0.00E+00 0.00E+00 0.00E+00 0.00E+00 0.00E+00 0.00E+00 0.00E+00 0.00E+00 3.60E-07 0.00E+00 1.21E-01 HLRW [kg] 3.26E-07 1.37E-09 3.35E-08 0.00E+00 0.00E+00 0.00E+00 0.00E+00 0.00E+00 0.00E+00 0.00E+00 0.00E+00 1.41E-11 0.00E+00 5.02E-10 ILLRW [kg] 2.73E-04 1.15E-06 2.80E-05 0.00E+00 0.00E+00 0.00E+00 0.00E+00 0.00E+00 0.00E+00 0.00E+00 0.00E+00 1.19E-08 0.00E+00 4.49E-07 CRU [kg] 0.00E+00 0.00E+00 0.00E+00 0.00E+00 0.00E+00 0.00E+00 0.00E+00 0.00E+00 0.00E+00 0.00E+00 0.00E+00 0.00E+00 0.00E+00 0.00E+00 MR [kg] 0.00E+00 0.00E+00 1.58E-02 0.00E+00 0.00E+00 0.00E+00 0.00E+00 0.00E+00 0.00E+00 0.00E+00 0.00E+00 0.00E+00 0.00E+00 0.00E+00 MER [kg] 0.00E+00 0.00E+00 0.00E+00 0.00E+00 0.00E+00 0.00E+00 0.00E+00 0.00E+00 0.00E+00 0.00E+00 0.00E+00 0.00E+00 0.00E+00 0.00E+00 EE [MJ] 0.00E+00 0.00E+00 0.00E+00 0.00E+00 0.00E+00 0.00E+00 0.00E+00 0.00E+00 0.00E+00 0.00E+00 0.00E+00 0.00E+00 0.00E+00 0.00E+00
11 Interpretation For all the products in study, the majority of the environmental impacts come from the Product Stage, which includes raw material sourcing, transportation and manufacturing. Installation contributes over 90% to GWP because of releases of propellants during installation. Distribution to customer (A4) also contributes significantly (10% or more) to SFP impacts. All other life cycle stages contribute 5% or less each to the cradle-to-grave impacts in all impact categories. Reference • Life Cycle Assessment, LCA report for Sto Corp. WAP Sustainability, July 2024 • BTY Group. (2001). Life-cycle Cost Study of Stucco and EIFS Exterior Wall Systems. • CML - Department of Industrial Ecology. (2016, September 05). CML-IA Characterisation Factors. Retrieved from https://www.universiteitleiden.nl/en/research/research-output/science/cml-ia-characterisation-factors • Frauenhofer IBP. (2015). Assessing The Long-Term Performance of Applied External Thermal Insulation Composite Systems (ETICs). • IPCC. (2013). Climate Change 2013: The Physical Science Basis. Contribution of Working Group I to the Fifth Assessment Report of the Intergovernmental Panel on Climate Change. [Stocker, T.F., D. Qin, G.-K. Plattner, M. Tignor, S.K. Allen, J. Boschung, A. Nauels, Y. Xia, V. Bex and P.M. Midgley (eds.)]. Cambridge, United Kingdom and New York, NY, USA: Cambridge University Press. • ISO. (2006). ISO 14025: Environmental labels and declarations - Type III environmental declarations - Principles and procedures. Geneva: International Organization for Standardization. • ISO. (2006). ISO 14040/Amd 1:2020: Environmental management - Life cycle assessment - Principles and framework. Geneva: International Organization for Standardization. • ISO. (2006). ISO 14044/Amd 1:2017/Amd 2:2020: Environmental Management - Life cycle assessment - Requirements and Guidelines. Geneva: International Organization for Standardization. • ISO. (2017). ISO 21930: Sustainability in buildings and civil engineering works - Core rules for environmental product declara-tions of construction products and services. Geneva: International Organization for Standardization. • Sto SE & Co. KGaA and Sto Scandinavia AB. (2020). ENVIRONMENTAL PRODUCT DECLARATION: StoVentec R. Institut Bauen und Umwelt e.V. (IBU). • US EPA. (2012). TRACI: The Tool for the Reduction and Assessment of Chemical and Other Environmental Impacts. Version 2.1 - User Guide. Retrieved from https://nepis.epa.gov/Adobe/PDF/P100HN53.pdf • US EPA. (2020). Advancing Sustainable Materials Management: 2018 Fact Sheet. • US EPA. (2020). Advancing Sustainable Materials Management: 2018 Fact Sheet. Retrieved from epa.gov: https://www.epa.gov/sites/default/files/2021-01/documents/2018_ff_fact_sheet_dec_2020_fnl_508.pdf • US EPA. (2023). Documentation for Greenhouse Gas Emission and Energy Factors Used in the Waste Reduction Model (WARM) Background Chapters. U.S. Environmental Protection Agency Office of Resource Conservation and Recovery.